Using CHouse UIData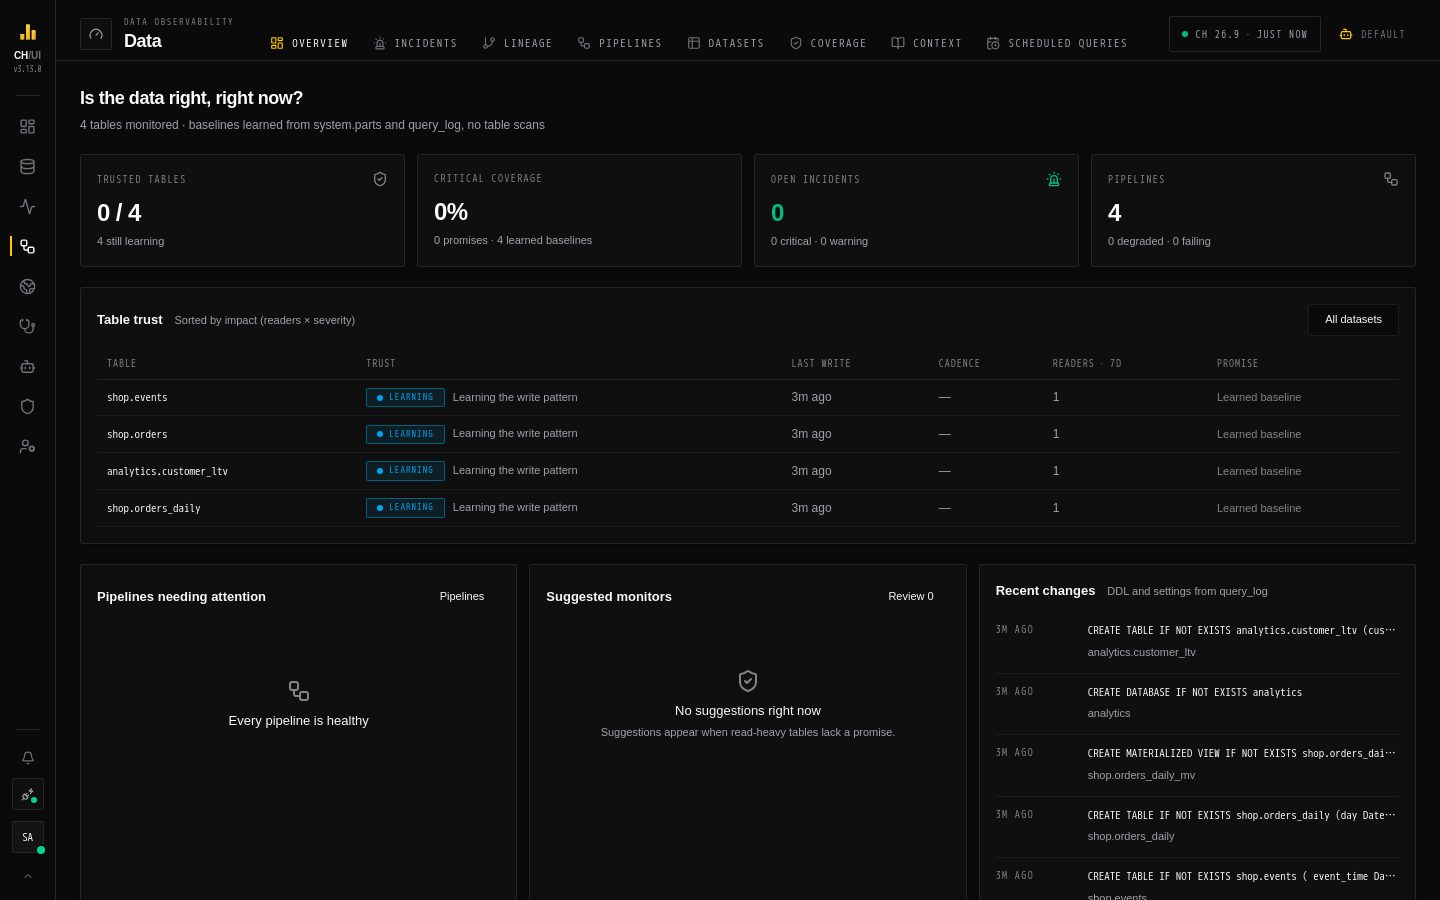
Data › Overview
Overview
One screen for whether the data is right: trusted tables, critical coverage, open incidents with their root cause, pipelines and suggestions.
- In the app
- Data › Overview
/data/overview - Needs
- observe:view
Data › Overview is the one-screen answer to is the data right, right now? for the active connection. Start here; every panel links to the tab with the detail.
What's on the screen
| Panel | Shows | Opens |
|---|---|---|
| Trusted tables | Share of observed tables in the trusted state | Datasets |
| Critical coverage | Share of critical tables protected by a promise | Coverage |
| Open incidents | Open data and pipeline incidents, each with its computed root cause | Incidents |
| Pipelines needing attention | Pipelines that are lagging, stalled, retrying, failing or stopped | Pipelines |
| Table trust | Tables by trust state — learning, trusted, degraded, stale | Datasets |
| Suggested monitors | Read-heavy tables without a promise, with an Accept button | The promise wizard |
| Recent changes | DDL and settings changes seen in query_log | — |
An incident whose root cause is still being computed shows Open investigation instead; the chain appears once the evidence is in.
Common tasks
- Triage the day — read Open incidents top to bottom; each row names the root cause, so you can go straight to the owner of the broken layer.
- Protect an important table — under Suggested monitors, Accept opens the promise wizard pre-filled for that table (needs
data_health:edit). - Check a pipeline — click a row under Pipelines needing attention for its samples and latest error.
If the page says No tables observed yet, the collector hasn't finished its first pass or lacks grants — see How data is watched.