
Performance
Each query shape against its own 14-day baseline, regressions lined up with the upgrades, DDL and setting changes around them.
- In the app
- Monitoring › Performance
/monitoring/performance - Needs
- performance:view
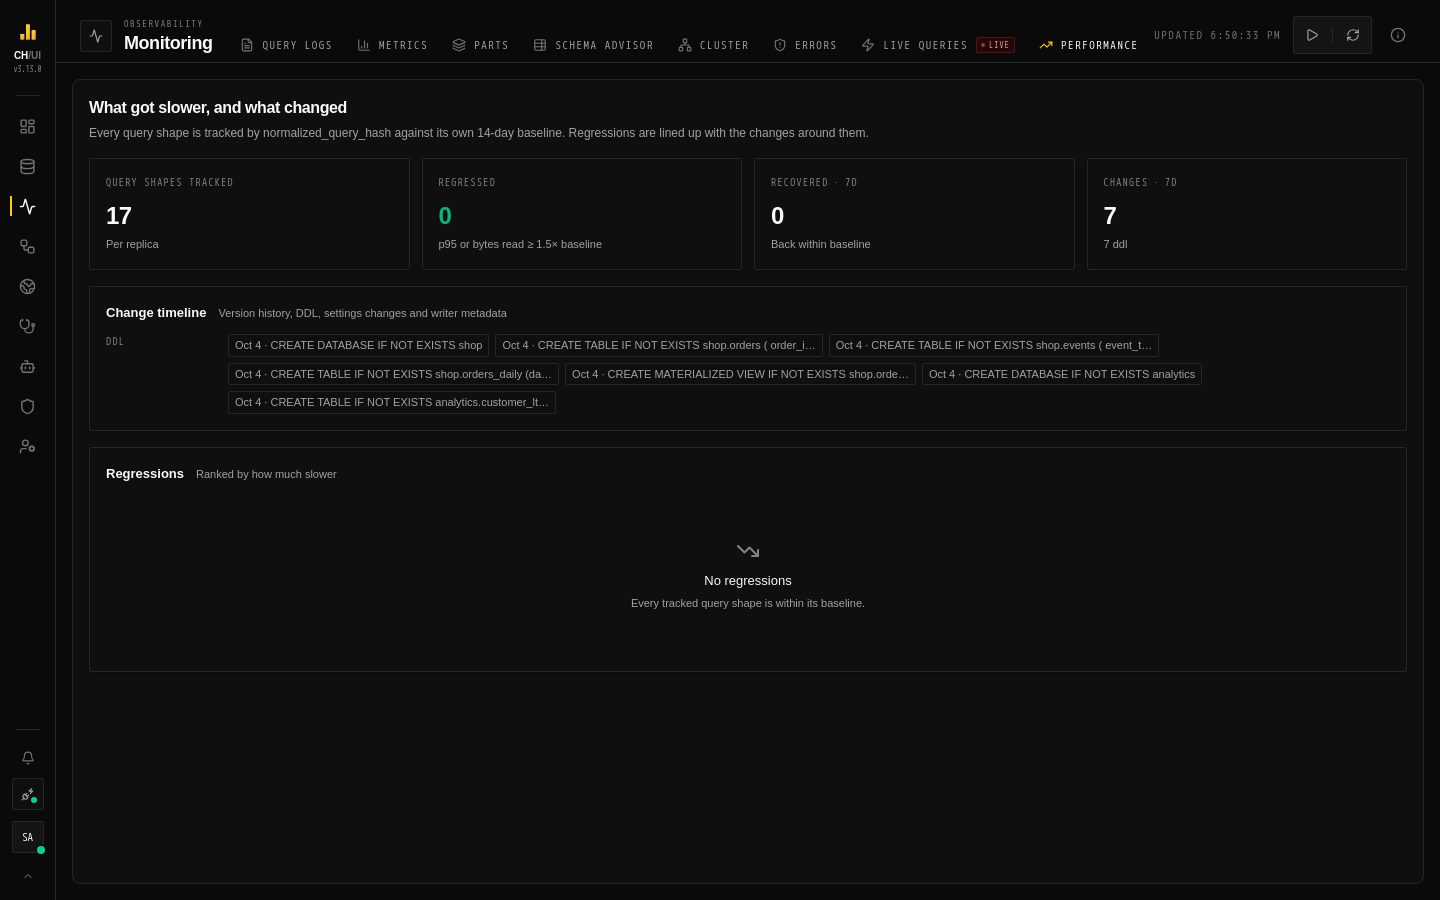
Monitoring › Performance answers what got slower, and what changed? Every query shape is tracked against its own history, and regressions are lined up with the changes that happened around them.
How regressions are found
A query shape is a normalized query (normalized_query_hash in system.query_log), tracked per replica. For each shape, CHouse UI keeps a 14-day baseline. A regression is a shape whose p95 latency or bytes read rises to 1.5× its baseline or more. Up to OBSERVE_MAX_FINGERPRINTS shapes (default 5000) are tracked per connection.
What's on the screen
| Area | Shows |
|---|---|
| Header | Query shapes tracked, Regressed, Recovered · 7d, Changes · 7d |
| Regressions | Each regressed shape, how much worse it is, and since when |
| Change timeline | Version upgrades, DDL, settings-profile changes and writer releases over the last 7 days |
Open a regression to see p95 latency per replica and the changes around the onset — the most likely culprits.
Compare plans
With query:history:view:all, run EXPLAIN indexes = 1 for the shape on this connection — and, with Compare with connection, on another one (for example a replica already on the new version) to see whether the plan changed.
Next steps
- A regression that started with an upgrade → check Upgrades and replay the workload on a canary.
- A slow shape you own → optimize it with Chouse AI from Query logs.