
Cluster
Mutations, replication queue, blocked-task indicators and per-replica lag from system.mutations and system.replicas.
- In the app
- Monitoring › Cluster
/monitoring/cluster - Needs
- cluster:view
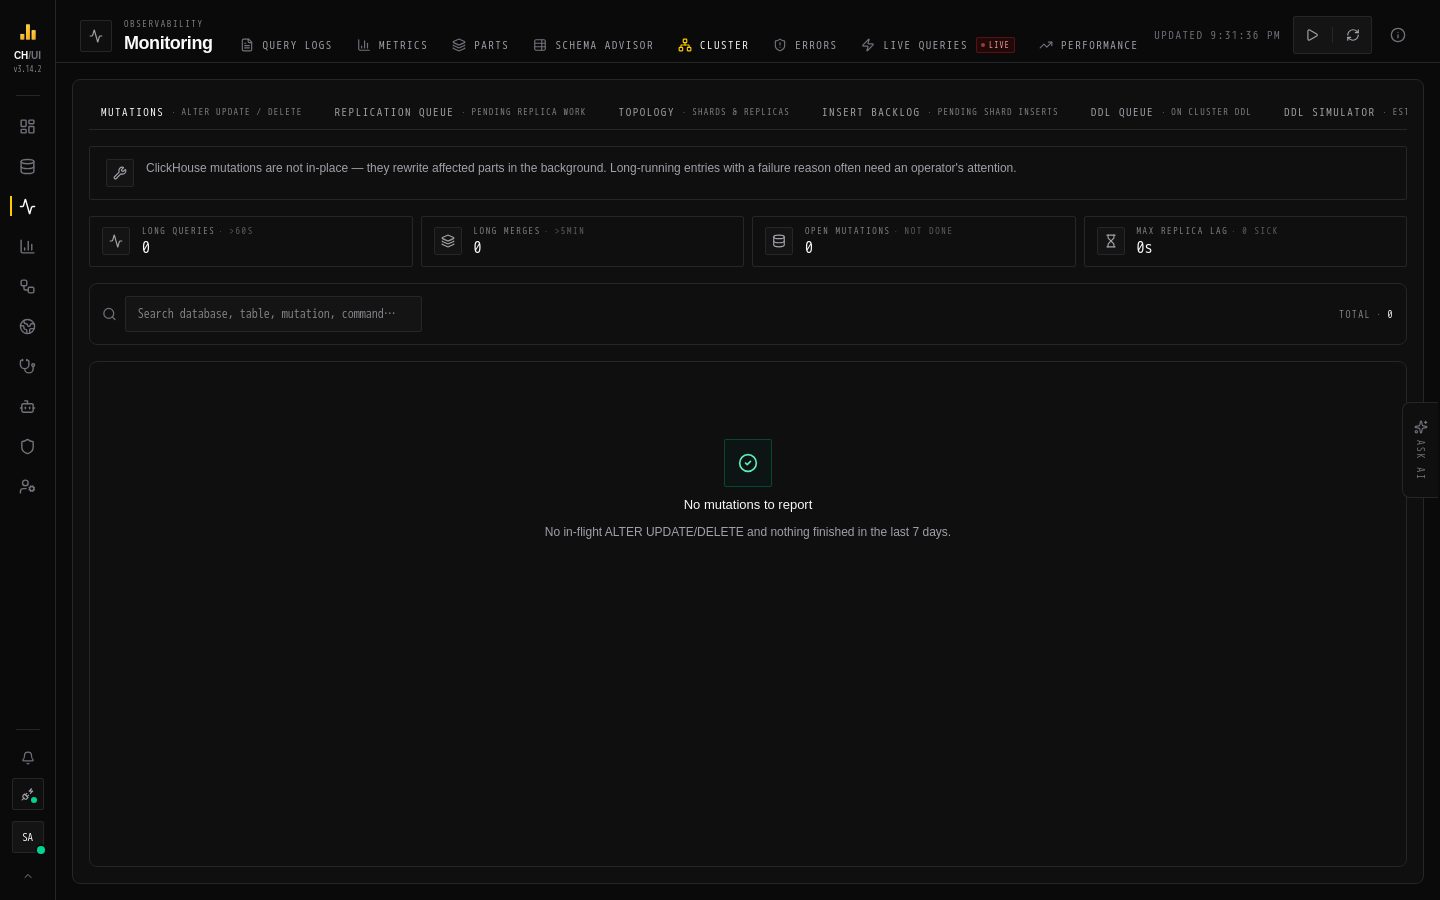
Monitoring › Cluster (/monitoring/cluster, permission cluster:view) answers is the machinery stuck? — mutations, replication, topology, the insert backlog and ON CLUSTER DDL at a glance.
Panels
Mutations (system.mutations)
- Every mutation with status chips (done / pending / failed)
- Sortable by age — stuck mutations bubble to the top
Replication queue (system.replication_queue)
- Pending replication tasks per table
- Long-lived queue entries indicate a replica falling behind or a ZooKeeper/Keeper issue
Per-replica status (system.replicas)
- Lag per replica (absolute and relative to the leader)
- Queue depth per replica
Topology (system.clusters)
Shards and replicas of each cluster, with per-host health such as error counts — check it when lag or DDL points at one host.
Insert backlog (system.distribution_queue)
Inserts into Distributed tables waiting to be sent to their shards. A growing backlog means a shard is unreachable or slow. (Shown as unavailable on servers without this table.)
DDL queue (system.distributed_ddl_queue)
ON CLUSTER DDL from the last day per host, so a statement stuck or failed on one replica is visible.
DDL simulator
Paste an ALTER TABLE … UPDATE or ALTER TABLE … DELETE to estimate it before running it: affected rows, parts and bytes rewritten, duration and disk needed. It only runs read-only estimate queries — it never executes the mutation — and accepts nothing but UPDATE/DELETE mutations.
Blocked-task indicator strip
A compact strip aggregates the four "cluster is struggling" signals:
| Signal | Threshold behavior |
|---|---|
| Long queries | Queries running past a threshold |
| Long merges | Merges taking too long |
| Open mutations | Mutations pending too long |
| Max replica lag | The worst replica lag in the cluster |
A non-empty strip means: look at parts and the tables below before trusting dashboards.
Typical reads
| Strip state | Meaning | First check |
|---|---|---|
| Empty | Machinery healthy | Nothing |
| Long merges + many parts | Ingest rate outpacing merges | Parts view, schema advisor |
| Open mutations | Someone ran heavy ALTERs | Mutations table |
| Max replica lag | A replica is behind | Per-replica panel; Keeper health in Metrics → ZooKeeper |
Underlying data
| Table | Used for |
|---|---|
system.mutations | Mutations panel |
system.replication_queue | Queue panel |
system.replicas | Replica lag/depth |
system.clusters | Topology |
system.distribution_queue | Insert backlog |
system.distributed_ddl_queue | DDL queue |
system.query_log | Long-query signal in the strip |
Tip: Pair this tab with a threshold alert on replica lag — the strip tells you when you're on the page; the alert tells you when to open the page.