Capacity
Disk forecasts per node, top growth, codec trials on samples and cost by consumer.
- In the app
- Monitoring › Capacity
/monitoring/capacity - Needs
- capacity:view
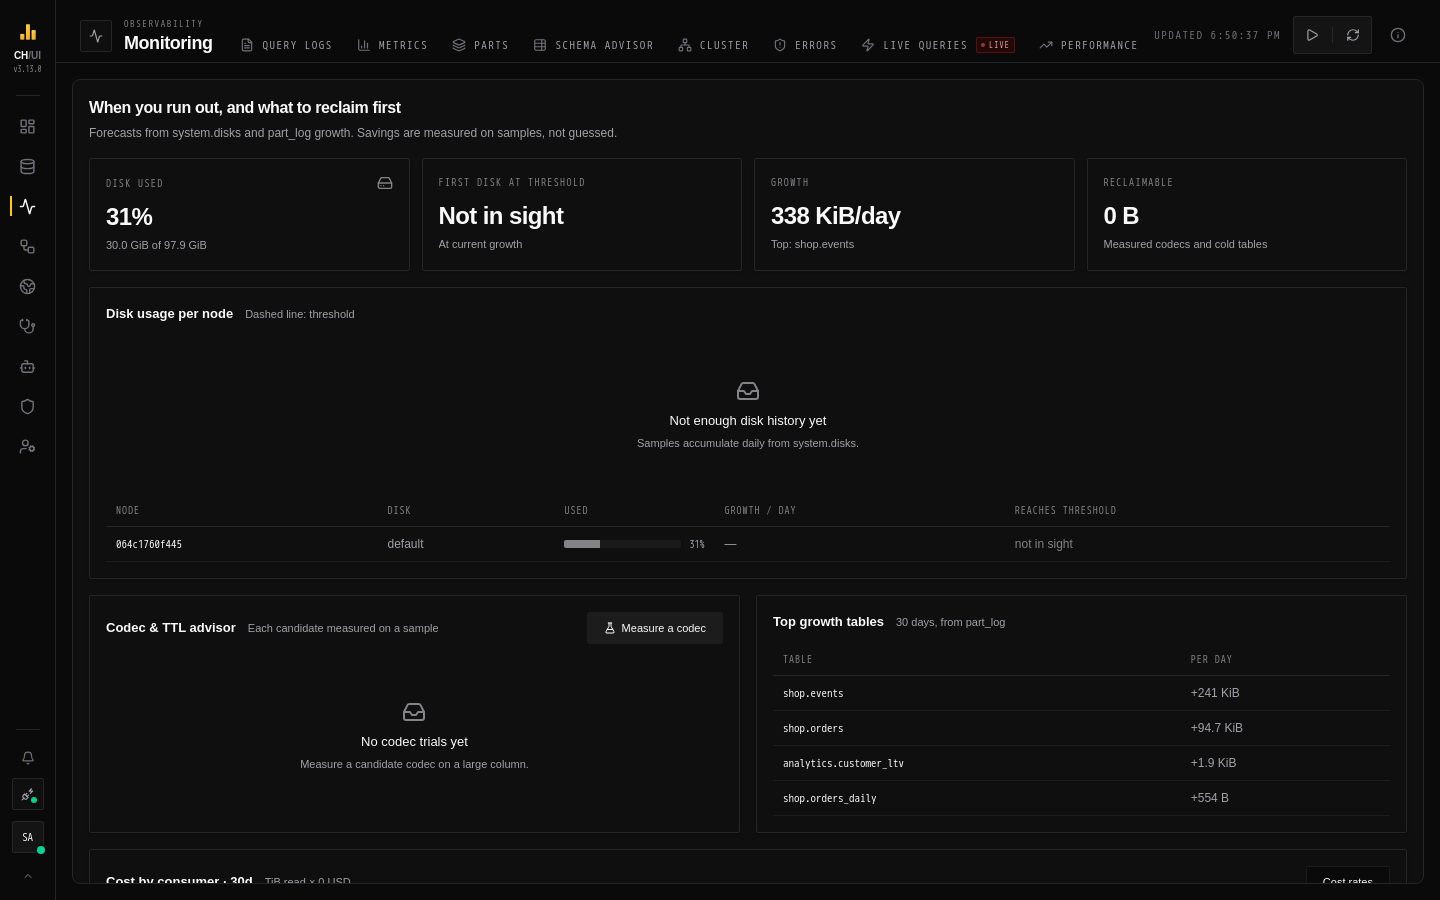
Monitoring › Capacity tells you when you run out of disk, and what to reclaim first. Forecasts come from system.disks and part_log growth; codec savings are measured on samples, not guessed.
What's on the screen
| Area | Shows |
|---|---|
| Header | Disk used, First disk at threshold, Growth, Reclaimable |
| Disk usage per node | Used ratio per node over 30 days |
| Disk forecasts | When each disk reaches the threshold (OBSERVE_CAPACITY_THRESHOLD, default 85%) |
| Top growth | The fastest-growing tables |
| Codec & TTL advisor | Where a better codec or a TTL would save the most |
| Codec trials | Results of codec measurements you ran |
| Cost by consumer · 30d | Bytes read and CPU per consumer, priced at your rates (needs cost:view) |
Tables that are still written but never read are listed on Data › Coverage as cold data.
Measure a codec
Measure a codec (needs upgrades:run) copies a 1M-row sample of one column into the scratch database (OBSERVE_SCRATCH_DATABASE, default chouse_scratch) and compares compression with the candidate codec. The original table is never touched. The connection's user needs write access to the scratch database.
When the saving is worth it, apply the codec as a fix — codec changes run only inside the maintenance window.
Cost rates
Costs are estimates: TiB read × your rate plus CPU-hours × your rate. Set the Currency, Per TiB read and Per CPU-hour rates under Cost rates (needs settings:update).