
Fleet view
Every connection side by side with status, memory, lag and trends, sampled by the server — not by every browser.
- In the app
- Fleet
/fleet - Needs
- fleet:view
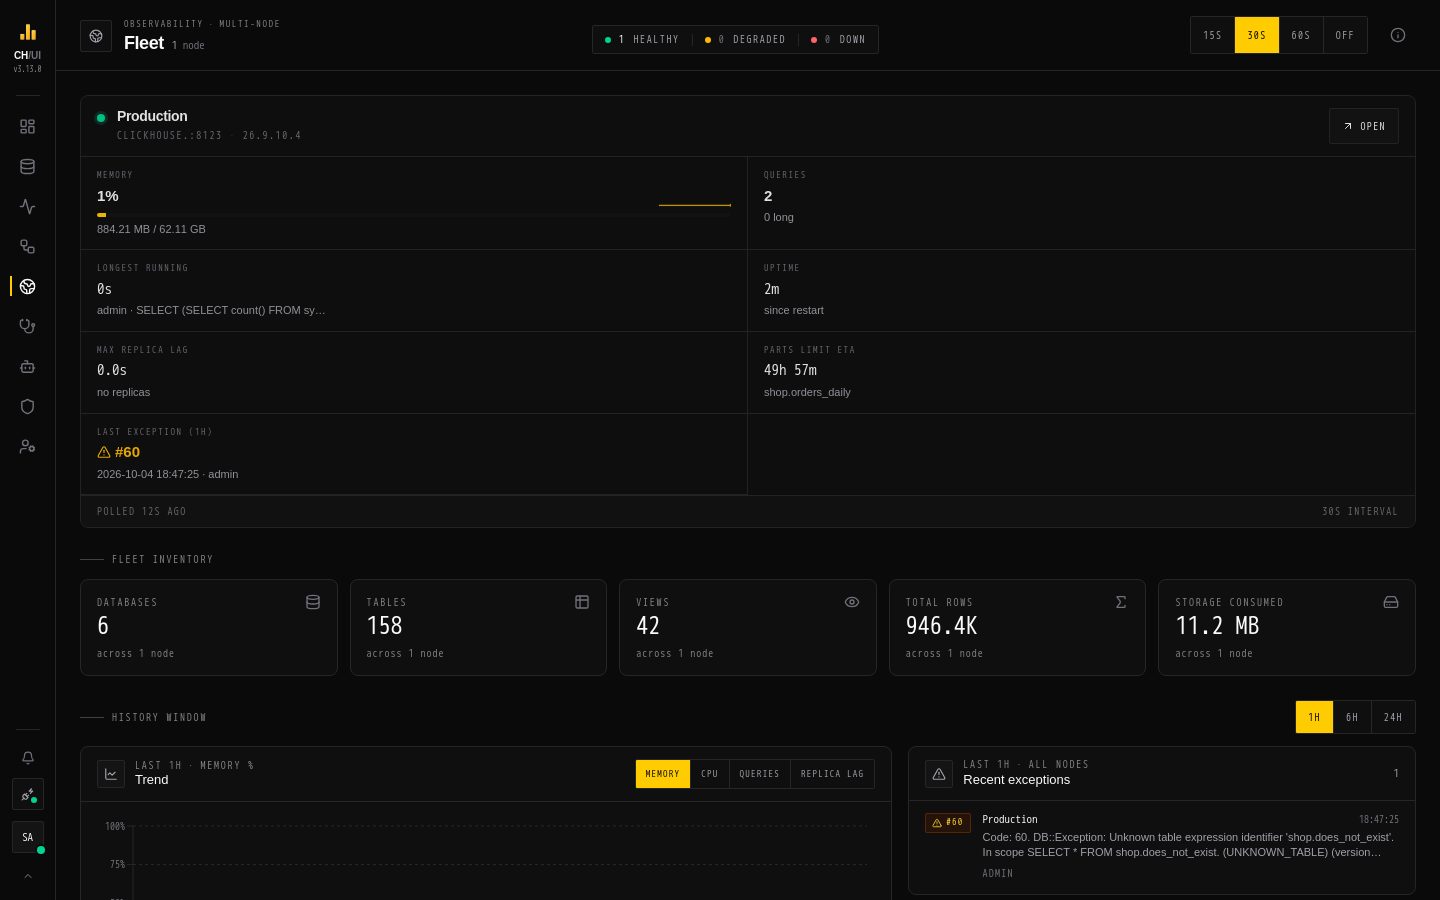
Fleet shows every ClickHouse connection you can reach side by side, one card per connection, so you can see the whole estate at once and drill into the one that needs attention.
What's on the screen
| Area | Shows |
|---|---|
| Status counts | How many connections are healthy, degraded or down — click one to filter |
| Cards (or compact rows) | Per connection: status, memory use, active queries, the longest-running query, replica lag and per-node trend sparklines |
| Fleet inventory | Databases and tables at a glance |
| Fleet trends | Memory and lag over the selected history window |
| Recent exceptions | The latest errors from system.errors across the fleet |
Use the toolbar to filter by name or host, sort, switch between card and compact row view, pick the history window and set auto-refresh (15s, 30s, 60s or off).
Click a card to open that connection's Monitoring with it already selected.
Where the numbers come from
The browser doesn't query your clusters. A collector on the server samples every connection on a fixed interval and stores snapshots, and the Fleet page reads those. One request serves every viewer, however many tabs are open.
| Setting | Default | Effect |
|---|---|---|
OBSERVE_FLEET_INTERVAL | 30 | Seconds between samples (FLEET_POLL_INTERVAL_SECONDS still works; this one wins) |
FLEET_RETENTION_HOURS | 24 | How much history the trends can show |
FLEET_METRIC_TIMEOUT_SECONDS | 15 | Time limit for one metric query against a cluster |
The collector runs on every pod; a lease per connection makes sure only one pod samples each connection at a time, so adding replicas doesn't multiply the load on ClickHouse. It reads system.metrics, system.asynchronous_metrics, system.processes, system.errors and system.replicas.
Note: Before 3.14 the collector was optional (FLEET_POLLER_ENABLED). It now always runs; the variable is ignored with a warning.
If the page shows Snapshot worker stalled, no fresh samples have arrived. Check the server logs for collector errors and that the connection's user can read the system tables (Admin › Connections › Edit › Check privileges).
Alerts
Fleet samples also feed threshold alerts — node memory, per-query memory and long-running queries — delivered to Slack or email, optionally with an automatic Doctor root-cause report.
Who can see it
fleet:view opens the page. Users see a card for each connection their roles' data access policies allow; super admins see every connection. Users without fleet:view land on Home for their connection instead.