
Pipelines
Kafka, RabbitMQ, NATS, S3Queue, AzureQueue, replication, views and writers in one status vocabulary, with samples and errors.
- In the app
- Data › Pipelines
/data/pipelines - Needs
- observe:view
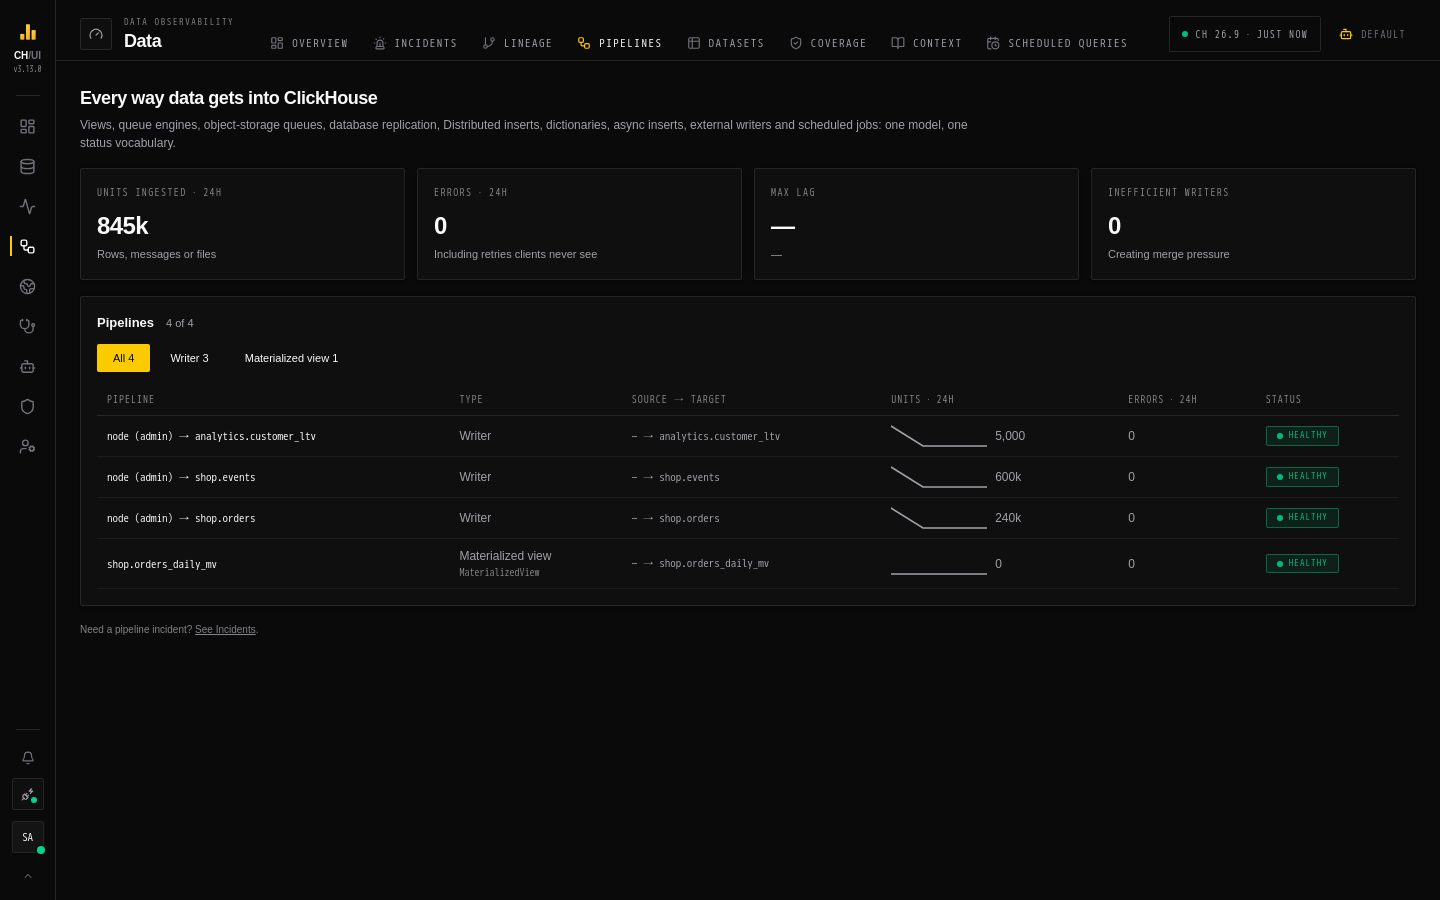
Data › Pipelines lists every way data gets into ClickHouse on the active connection, each with one status in one vocabulary, so a stuck Kafka consumer and a failing S3 queue look the same way.
What counts as a pipeline
| Kind | Evidence |
|---|---|
| Materialized views | system.query_views_log |
| Refreshable views | system.view_refreshes |
| Queue engines — Kafka, RabbitMQ, NATS | system.kafka_consumers (Kafka) and the outcomes of the attached views |
| Object-storage queues — S3Queue, AzureQueue | system.s3queue_log / azure_queue_log and the queue metadata |
| Database replication — MaterializedPostgreSQL, MaterializedMySQL | Writes in system.part_log |
| External tables — PostgreSQL, MySQL, S3, URL, … | Reads in query_log |
Distributed inserts, dictionaries, async inserts, Buffer | Their system tables |
| External writers and scheduled jobs | query_log grouped by client, CHouse UI job runs |
Statuses
| Status | Meaning |
|---|---|
| healthy | Progressing within its learned cadence |
| lagging | Behind its source but still progressing |
| stalled | No progress while work is pending |
| retrying | Repeating the same work without committing — e.g. a consumer replaying a batch that a view keeps rejecting |
| failing | Errors while some work still lands |
| stopped | Nothing has succeeded for well beyond its known cadence: a job's schedule, a view's refresh interval, or a cadence learned from a regular writer |
| inefficient | Healthy, but writing in tiny inserts that create merge pressure |
| paused | Switched off on purpose — a disabled scheduled query or a view stopped with SYSTEM STOP VIEW. Never opens an incident |
| unsupported on this version | This ClickHouse version doesn't expose the evidence (e.g. no s3queue_log on 23.8) |
The point is the failures clients never see: a consumer stuck on one batch, a file that failed every retry, a view that rejects each insert. They stay on the list until data flows again, and open an incident when the pipeline stays bad for five minutes (OBSERVE_INCIDENT_HOLD_SECONDS) and feeds a table that is promised, critical or important. The incident recovers once the pipeline is healthy, paused or gone.
Going quiet is not the same as stopping. A source without a known cadence (a one-off writer, a dictionary that reloads only when its source changes) is never called stopped. A Kafka consumer still polling an empty topic stays healthy, and a replicated database is judged as a whole, so a quiet source table is fine. A scheduled query is judged by its latest run: a failure that a retry fixed does not count, and a failed run stays failing until the next run succeeds. Failed reads of an external table count only when the source itself is unreachable, not when the query had a typo.
Use the page
- The header totals Units ingested · 24h, Errors · 24h, Max lag and Inefficient writers.
- Filter by Pipeline type and status; pipelines needing attention sort first.
- Inspect a pipeline for its samples over the last 48 hours — throughput, lag, backlog, errors — and the latest error, its source and target, and links to the target dataset and its lineage.
Error texts can quote the data they failed on, so they are shown only to users with query:history:view:all.
Agents read pipeline status with the MCP get_pipeline_status tool; from a script, chouse incidents lists the pipeline incidents with their root cause.