Dashboards
Your own charts of ClickHouse: panels, variables, time range and refresh, sharing, fleet panels, panel alerts, templates and dashboards as code.
- In the app
- Dashboards
/dashboards - Needs
- dashboards:view
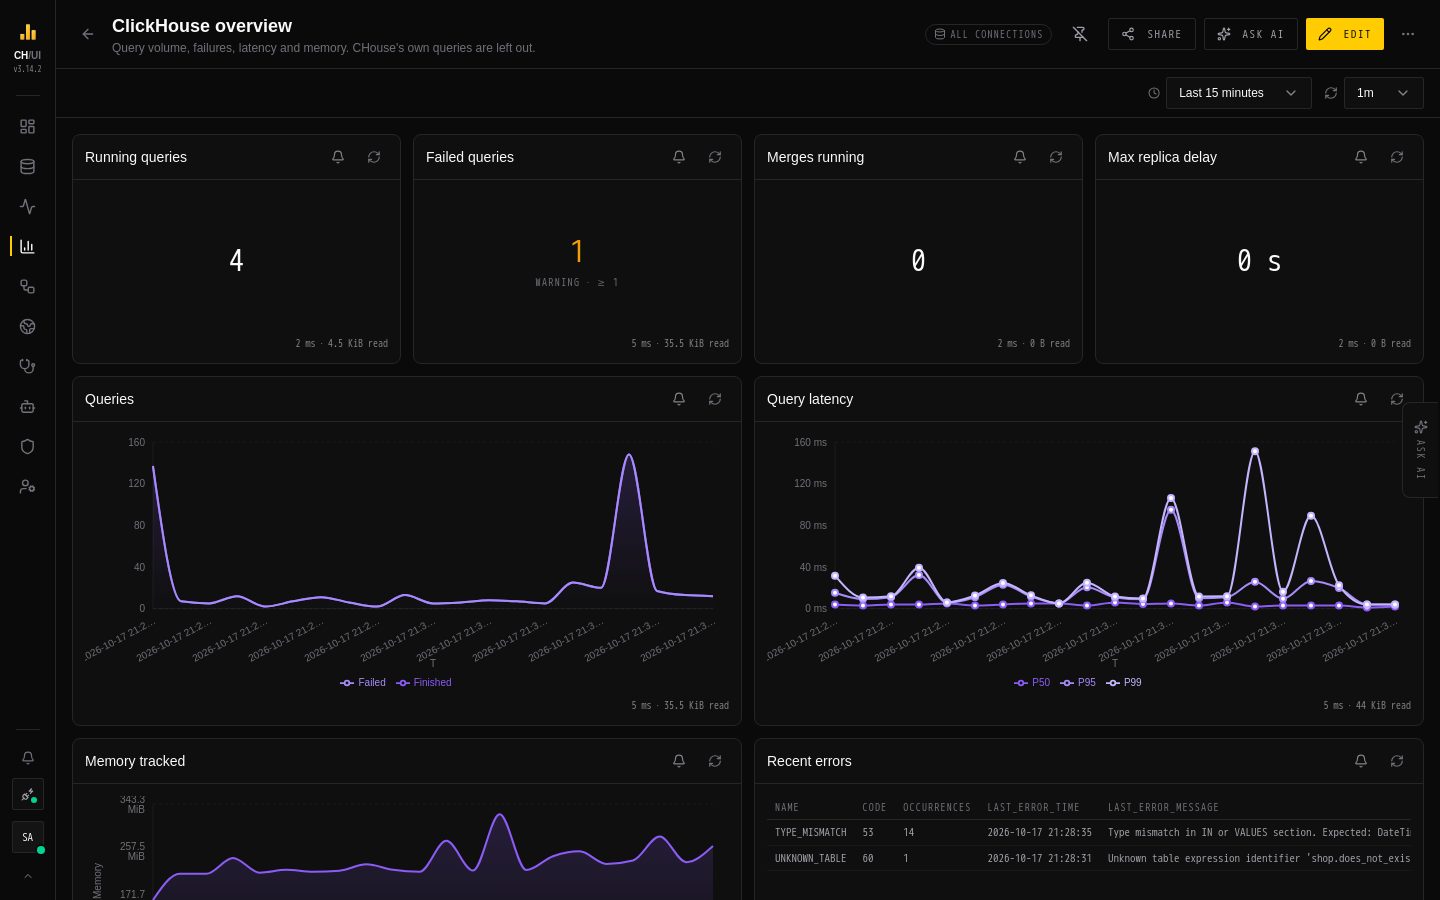
Dashboards (/dashboards) are your own charts of ClickHouse: each panel is a read-only query with a chart, and a dashboard puts panels side by side with a shared time range, variables and auto-refresh. They are built on what CHouse already knows about you. A panel runs with each viewer's own connection and table access, so a shared dashboard never shows anyone more than they could query themselves.
The page lists the dashboards you pinned, your own, and those shared with you, plus the curated templates. Open one at /dashboards/<id>.
Who sees what
| Permission | Allows | Built-in roles |
|---|---|---|
dashboards:view | Open dashboards you own or that are shared with one of your roles | Viewer, Analyst, Developer, Admin |
dashboards:edit | Create dashboards; edit your own and those shared with you for editing | Analyst, Developer, Admin |
dashboards:delete | Delete your own dashboards | Analyst, Developer, Admin |
dashboards:share | Share your own dashboards with roles | Developer, Admin |
dashboards:manage | See, edit, share and delete every dashboard | Admin |
Running a panel also needs query:execute, and the panel's tables must be allowed by your data access rules. A panel you may not run shows why, such as Access denied to orders.events. It is never hidden or shown empty.
Start a dashboard
- New dashboard starts empty and opens in edit mode.
- Use template copies a curated template into a dashboard you own: ClickHouse overview, Merges and parts, Replication, Query latency, Disk and tables, and Kafka and S3Queue ingestion. Monitoring › Performance and Monitoring › Capacity have Open as dashboard, which does the same for their template.
- Pin to dashboard in the SQL workspace's Chart tab adds the query you just ran, with its chart, to a dashboard you can edit, or to a new one.
- Import creates a dashboard from an exported JSON file.
- Ask AI drafts one from a goal. See Draft dashboards with AI.
The view bar
- Variables: one picker per variable the dashboard defines.
- Time range: from the last 15 minutes to the last 30 days.
- Auto-refresh: off, 30 s, 1 m, 5 m or 15 m. It pauses while the browser tab is in the background.
Panels run on your active connection, the one picked in the dock, like every other page. See Connections for which dashboards you see on which connection.
The time range and variable values are kept in the page's URL, so a link opens the view you are looking at, on the reader's own active connection. A link with a value the dashboard does not know, such as an unknown time range, says so and uses the dashboard's own setting instead.
Connections
Each dashboard is assigned to All connections or to a list of connections. Click the connections chip next to the dashboard's title to change them (it saves straight away), or use Settings › Connections while editing. New dashboard and Use template let you pick when you make one, starting with the connection you are on; a dashboard drafted with AI or made by pinning a query is assigned to the connection you are on.
- Dashboards and Home list only the dashboards assigned to your active connection. Switch connection in the dock to see the others; the list says how many there are.
- A link to a dashboard that is not assigned to your active connection runs nothing. It says which connections the dashboard is for, with a button to switch to each one you may use.
- You can assign only connections you may use. If the dashboard is also assigned to connections you cannot use, you see how many, not their names, and your save keeps them.
- An imported dashboard keeps its connections. Connections that do not exist on this CHouse are refused, never dropped: edit the file's
connectionScopefirst. - A dashboard on an assigned connection may still read a table that connection does not have. That panel says so, naming the connection, and the rest still draw.
Edit a dashboard
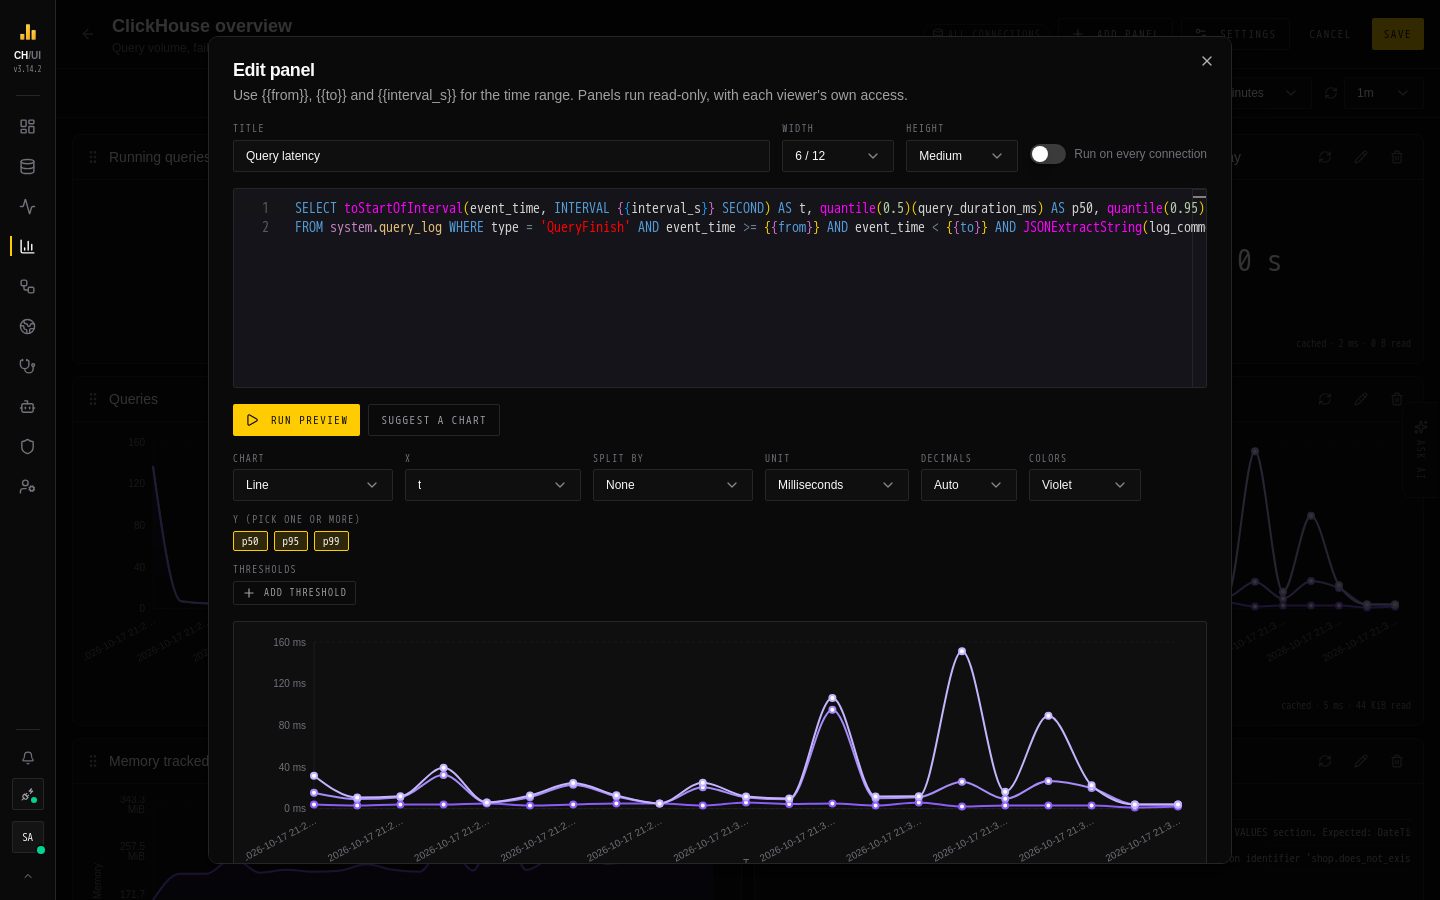 Editing a panel: its SQL, a preview of the result and the chart settings
Edit starts an edit session. Nothing is saved until Save:
- Add panel, or the pencil on a panel: write the SQL, run a preview, and set the chart: type, x and y columns, split by series, unit, decimals, thresholds and colors. Suggest a chart picks one from the result's column types.
- Drag the grip to reorder panels, and set each panel's width (3, 4, 6, 8 or 12 of 12 columns) and height.
- Settings: title, description, default time range and refresh, connections, and the variables.
- Run on every connection makes a fleet panel. See Fleet panels.
Save stores the whole dashboard at the version you opened. If someone saved it in the meantime, your save is refused: reload to see their version. Removing a panel that has alerts asks first, and its alerts are deleted with it.
Panel SQL
A panel is one read-only SELECT, without a FORMAT clause. Use these macros. They become native ClickHouse query parameters and are never pasted into the text:
| Macro | Value |
|---|---|
{{from}}, {{to}} | The time range, as DateTime |
{{interval_s}} | A bucket size in seconds that gives about 120 points over the range |
{{var.NAME}} | The selected value of variable NAME |
SELECT toStartOfInterval(event_time, INTERVAL {{interval_s}} SECOND) AS t,
       quantile(0.95)(query_duration_ms) AS p95
FROM system.query_log
WHERE type = 'QueryFinish' AND event_time >= {{from}} AND event_time < {{to}}
GROUP BY t ORDER BY t
A macro inside quotes or a comment is an error: write {{from}}, not '{{from}}'.
Variables
A variable is either a text value (bound as String) or a database or table name (bound as Identifier, letters, digits and _ only), so FROM {{var.db}}.{{var.table}} reads the table the viewer picked. Its values come from a list, or from a one-column SELECT that runs with each viewer's access. Data access is checked against the table actually selected.
Things to check
The editor flags charts that render and are still wrong:
- a running total (
system.events,system.errors, Kafka consumer counters) drawn as a line, withoutrunningDifference; - a numeric chart without a unit;
- an average of quantiles;
- a
system.*_logread without{{from}}, which scans the whole log on every refresh; - a pie or donut without a
LIMIT.
When the fix is mechanical, such as adding LIMIT 12, Apply fix makes it. A finding never blocks a save.
Limits
Every panel run is read-only (readonly=1) and capped. A capped query fails with a message instead of being cut short:
- 30 seconds of execution;
- 10,000 result rows: aggregate further (a coarser bucket, fewer groups) or add a
LIMIT; - 20 GiB read: narrow the time range or filter on the partition or primary key.
Results are shared between viewers for 30 seconds, so a dashboard ten people watch runs each panel about once per 30 seconds on each server, not once per viewer. Your own access is still checked on every request before a shared result is used. Dashboard queries are tagged in system.query_log (log_comment source dashboards) and left out of Performance.
Fleet panels
A panel with Run on every connection runs on every connection the dashboard is assigned to that you may use, up to 20 sorted by name, and draws one line or bar per connection. It works for line, area, bar, stat and table panels with one y column. A connection that fails is listed under the chart with its error, and the others still render.
Panel alerts
The bell on a panel lists its alerts (alerting:view). With alerting:edit and edit access to the dashboard, you can create one: alert when the last, max, min, avg or sum of one of the panel's y columns over a window is above or below a value, checked every few minutes, firing after a number of breaches in a row. It notifies the notification channels you pick when it fires, resolves, can't be evaluated, and evaluates again.
An alert runs on the connection that was active when it was created, which must be one the dashboard is assigned to (alerts are checked with no browser open, so they keep their own; a save that would unassign it is refused), with the variable values it was saved with, and with the access of the person who saved it. That access is checked again on every evaluation. If they are deactivated or lose access, the alert goes to Error with the reason and notifies once. It never passes silently. Enabled alerts draw their threshold on the panel's chart, red while firing. Admin › Alerting lists every panel alert with its state.
Sharing, pins and export
- Share gives roles view or edit access. It shows the dashboard to their members; it never widens what they can read.
- The pin button puts the dashboard on your Home page.
- Duplicate makes a copy you own. Export JSON downloads the dashboard (
chouse.dashboard/v1), which Import, the CLI and MCP take, so dashboards can live in git.
From the CLI and agents
- CLI:
chouse dashboard list,get,export,apply -f FILE,run-panel <dashboard> <panel> --range 24h --var db=shop, anddelete. - MCP:
list_dashboards,get_dashboard,export_dashboardandrun_dashboard_panelare on by default.apply_dashboard(write) anddelete_dashboard(destructive) are off until an administrator enables them. - In the chat, CHouse Admin can list dashboards and read their panels.
A panel run from a token goes through the same agent governance as any query.